Data Analysis
We provide ways for you to analyze your data. The following data analysis tools are available:
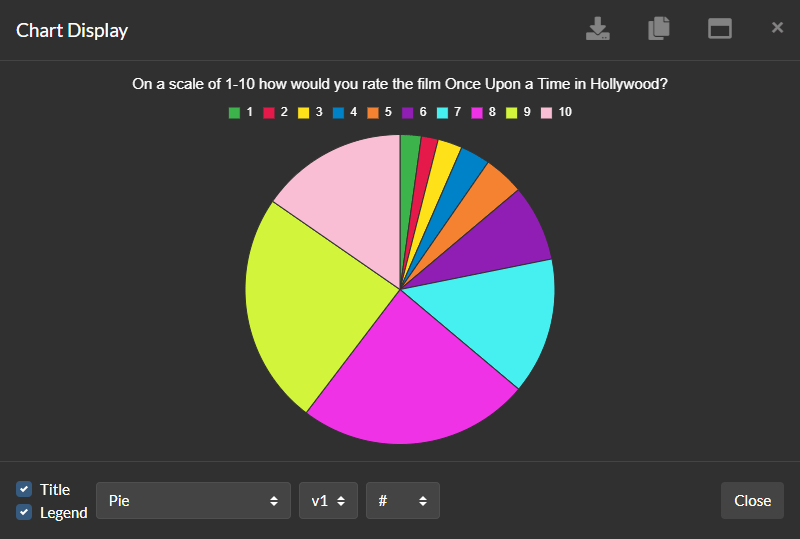
Visualize data
You can visualize the results of a poll with charts. Click the dropdown button in the upper right hand corner of the question you want to chart. Then click the chart button. This will open a dialog box that shows a chart for the question you selected. Use the fields in the footer of the dialog box to format the appearance of the chart. There are also buttons in the header of the dialog box. Use them to download the chart, copy the chart and maximize/restore the size of the dialog box.
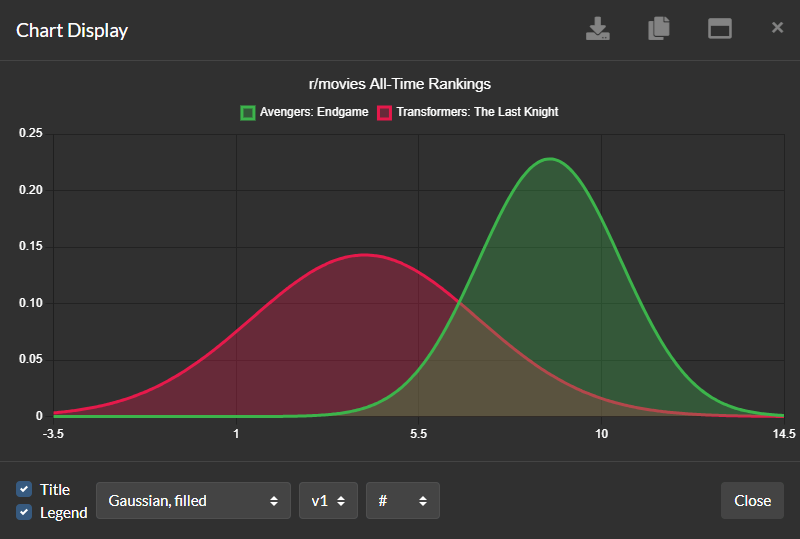
Compare data
You can compare the rows of a list with charts. Check the checkbox in the select column for each row you want to chart. Each row must have the same min, max and type. Click the dropdown button in the upper right hand corner of the list. Then click the chart button. This will open a dialog box that shows a chart for the rows you selected.
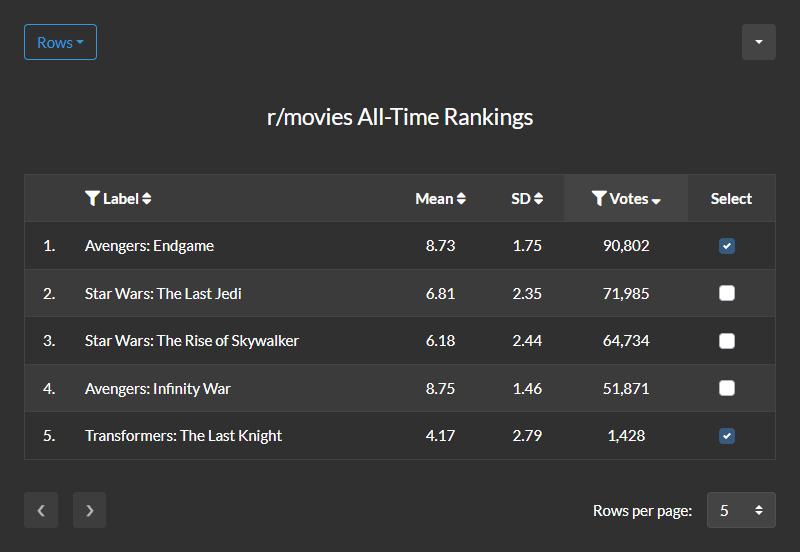
Use the fields in the footer of the dialog box to format the appearance of the chart. There are also buttons in the header of the dialog box. Use them to download the chart, copy the chart and maximize/restore the size of the dialog box.
Filter data
You can also filter the rows of a list. Click the dropdown button in the upper right hand corner of the list. Then click the filter button. This will open a dialog box with options to filter the list. Check the checkbox in the show columns section for each column you want in the list. Add row level filters in the show rows where section. Click the apply button to save your changes.
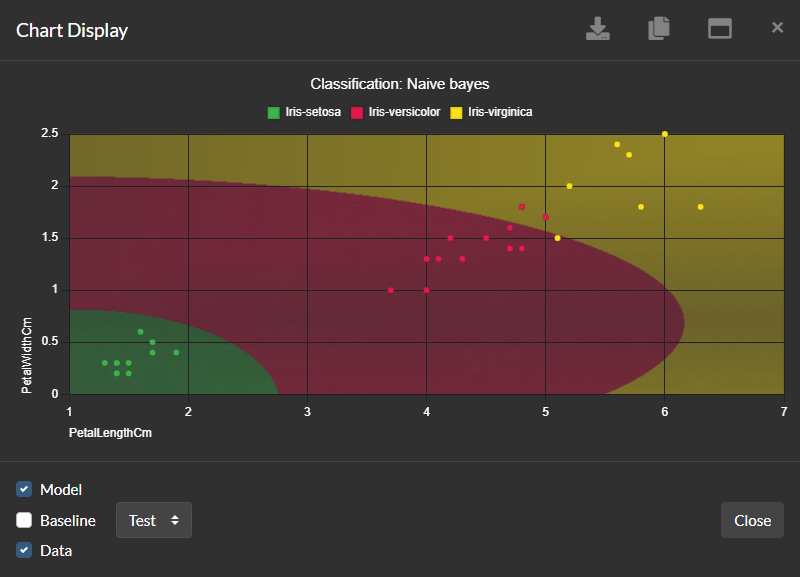
Machine learning
You can build models with our machine learning tool. The models are built using the results of your polls or external datasets. Our machine learning tool can solve regression, classification, clustering and dimensionality reduction problems. It also generates detailed reports based on the type of model you create. A new guide on how to use our machine learning tool will be available soon.